Tuesday, 21 February 2012
In my last couple of posts I've been writing about a problem I encountered when I moved into the 64 bit world of computing, but still had to work with a 16 bit DOS program and analyse its reports.
Last time I discussed how using Regular Expressions it was possible for me to extract the data that I needed from a text file based report. Having worked out how to acquire the data the next step was to store it in a new report that would make it much easier for me to spot those animals not eating their full ration and also view any trends.
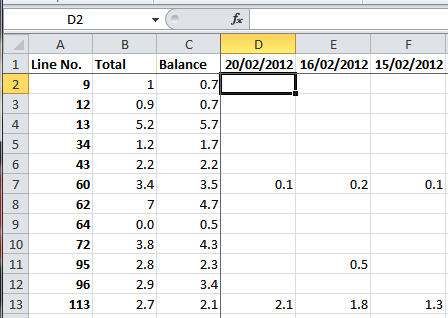
The screenshot below shows a snippet of the actual report:

So what do these numbers mean? First we need to identify the cow, so her brand number is inserted into column A. In column B the total feed for the period is inserted, this is so that I can easily compare what a cow should have eaten with what she did eat in the previous period and what her balance is for the current period (column C).
Inserted into column D and on is the date the text report was run, in the first row, and then the quantity of feed not eaten. Where a cell is blank then that means that the cow ate her full ration.
How is it done?
For many years (certainly ever since I've used it) the applications within Microsoft Office have provided the ability for an external program to feed data into them. In the late nineties the capability for the external program to pretty much fully control the Office application was added, using a technology called COM (Common Object Model).
This has been developed further with each release of Office and in order to make the development of add-ins easier, Microsoft developed a set of tools for the .Net Framework called Visual Studio Tools for Office, VSTO for short. When developing an add-in or an extension to Word or Excel you can create a VSTO project and create the document or spreadsheet within Visual Studio at the same time as adding buttons (or other types of control) to the document or spreadsheet, you can also add buttons to the ribbon.
I chose to add a button to the ribbon which invokes a small dialog that allows me to select the file containing the text based report and initiate the import. The first thing the import process does is to insert a new column into the column D position forcing all the succeeding columns to move across by one and then insert the date into cell D1.
The text file is then read and it is parsed by a regular expression parser using the regular expressions discussed in the last article. Having run the parser the result is a collection of matching items and so I then iterate that collection and read in the relevant group data.
For each item I first read the cow identity and then search for the number in column A. If found then I proceed to insert the total ration, current balance and previous balance in the succeeding cells (B1 - D1). However, if it isn't found then I first determine where a row should be inserted to keep column A sorted numerically and then insert it, followed by putting the identity into column A (in the new row) and then proceeding to insert the remaining data in the succeeding cells.
It's a relatively simple process and doesn't take a lot of code to achieve but the benefit is immense. While it's just as easy as before to see which cows didn't eat their ration in the previous period. But with the data from previous runs of the report preserved in a more readable fashion, it's much more easy to spot trends where cows are persistently not having their full ration, which can indicate either a possible health issue or a technical failure.